はじめに
PostgreSQLのベンチマークを行う際、pgbenchというツールはPostgreSQLに付属していることもあり、よく用いられると思います。
pgbenchはTPC-B(銀行の窓口業務をモデルにした単純なトランザクションによる性能評価基準)をベースとしたベンチマークで、もう少し高度なベンチマークを実施してみようと思い、TPC-Cベースのベンチマークが実行できるTPCC-UVaというツールを利用してみました。
開発が終わっているのか2006年を最後にリリースが止まっていますが、PostgreSQL 9.2に対しても実行できましたので、その手順等をまとめておきます。
TPCのベンチマーク基準
概要
一般的にデータベースのベンチマークには「TPC(Transaction Processing Performance Council)」という団体が定義している「TPC-A」「TPC-B」「TPC-C」「TPC-D」「TPC-H」「TPC-R」「TPC-W」という性能評価基準があります。このうち、TPC-A、B、D、R、Wは既に廃止(observe)となっていることもあり利用が少なく、現在ではTPC-CやTCP-E、TPC-Hあたりがよく利用されるものと思います。
TPC-C,E,Hの概要についてはTPCのサイトを参照していただければと思いますが、極簡単に記載しますと、
- TPC-C 卸売り会社の業務をモデルとしたトランザクション処理をシミュレートして性能を評価するベンチマーク
- TPC-E 証券会社の株取引業務をモデルとしたトランザクション処理をシミュレートして性能を評価するベンチマーク
- TPC-H 大型基幹業務向け意思決定支援環境をシミュレートして性能を評価するベンチマーク
となります。
特にTPC-Eはかなり複雑なモデルですがテストデータも実際のデータが用いられているようで、その分より正確なベンチマーク結果が得られると考えられますが、これらのベンチマークテストはそれぞれCPUやディスクのどちらにより負荷がかかるかなどが異なりますので、ベンチマークの仕様を把握して、実際に利用するシステムの目的に即したものを選択するのが良いと思います。
PostgreSQLのTPC-Cのベンチマークツール TPCC-UVa
公式サイトに記載がありますが、TPCC-UVaはLinux環境で実行できるC言語で書かれたPostgreSQL用のTPC-Cベースのベンチマークツールです。Diego R. Llanos氏、Eduardo Hernández Perdiguero氏、Julio Alberto Hernández Gonzalo氏らがスペインのバリャドリード大学の卒業研究として開発されたもののようです。
Although the TPC-C specifications are public, there was not a public implementation: each company develops and uses its own. We have developed an open-source version of the TPC-C benchmark, following the terms of the GPL license. This version, called TPCC-UVa, is written entirely in C language and can be run in any Linux system. It uses the PostgreSQL database system and a simple transaction monitor. This benchmark can be used to measure the speed of different computers or to analyze the behavior of individual components, either hardware or software, and its impact on the overall performance of the system. The development was started by Eduardo Hernández Perdiguero and Julio Alberto Hernández Gonzalo as their Bachelor's Thesis in the Escuela Universitaria Politécnica, University of Valladolid, with the advise of Diego R. Llanos.
また、これはPostgreSQL向けのTPC-Cのシンプルな実装であり、他のTPC-Cによる結果とは比較できないとのことです。
Note: To release TPCC-UVa as an open-source program, we use our own version of a very simple Transaction Monitor (TM), instead of using any commercial TM. Because of that, the results obtained with TPCC-UVa, particularly our performance parameter "TPCC-UVa Transactions per minute (tpmC-uva)" should not be compared with values of tpmC obtained with other implementations.
実行環境情報
インストールやベンチマークを実行する環境を以下に示します。
HW環境
HW環境は以下の通りです。
| プラットフォーム | さくらのVPS 512 |
| OS | CentOS 6.3 |
| CPU | Intel(R) Core(TM)2 Duo CPU T7700 @ 2.40GHz |
| Memory | 1GB |
| HDD | QEMU Virtual HARDDISK (Sector(Block) Size 512B) |
インストールディレクトリ
取得したTPCC-UVaのアーカイブの中にTPCC-UVaの他にPostgreSQL 8.1.4, GunPlotが含まれていますので、それらを全てインストールすることとして、インストール先ディレクトリ/作業ディレクトリをそれぞれ以下とします。
※TPCC-UVaの利用にはPostgreSQL 8.1.4(の中に含まれているlibecpg.so.5.1というライブラリ)が必要になります。
| 作業用ディレクトリ | /tmp |
| PostgreSQL 8.1.4インストール先ディレクトリ | /home/tpcc-uva/pgsql |
| Gunplotインストール先ディレクトリ | /home/tpcc-uva/bin |
| TPCC-UVaインストール先ディレクトリ | /home/tpcc-uva/bin |
インストール事前準備
作業は全てrootで実行しています。
$ su -
パスワード:
必要なパッケージのインストール
PostgreSQL 8.1.4のインストール時に下記のパッケージが必要になりますので、存在しない場合はインストールを行います。
# yum install zlib readline gcc
インストール先ディレクトリの作成
インストール先ディレクトリを作成します。
# mkdir /home/tpccuva
TPCC-UVaのソースコードの取得
/tmp配下にTPCC-UVaのソースコードを取得して展開します。
# cd /tmp
# wget http://www.infor.uva.es/~diego/tpccuva/tpccuva-1.2.3-tarball.tar.gz
# tar -zxvf tpccuva-1.2.3-tarball.tar.gz
展開したファイルの中にtpccuva-guide.pdfというPDFがあります。 基本的にここに記載されている手順に沿ってインストールを行います。
インストール
PostgreSQL 8.1.4のインストール
PostgreSQL 8.1.4のアーカイブファイルを展開します。
# cd /tmp/tpccuva-1.2.3-tarball
# bzip2 -dc postgresql-base-8.1.4.tar.bz2 | tar xvf -
展開して作成されたディレクトリに移動し、makeファイルを作成します。--prefixでインストール先を指定します。
# cd /tmp/tpccuva-1.2.3-tarball/postgresql-base-8.1.4
# ./configure --prefix=/home/tpcc-uva/pgsql
コンパイル、およびインストールを行います。
# gmake && gmake install
gunplot 3.7.1のインストール
続いて付属されているgunplotのインストールを行います。
# cd /tmp/tpccuva-1.2.3-tarball
# tar -zxvf gnuplot-3.7.1.tar.gz
# cd /tmp/tpccuva-1.2.3-tarball/gnuplot-3.7.1
# ./configure --prefix=/home/tpcc-uva/bin --without-x
# make && make install
TPCC-UVaのインストール
ログ生成先となるディレクトリを作成します。
# mkdir -p /home/tpcc-uva/var/tpcc
TPCC-UVaのファイルを展開します。
# cd /tmp/tpccuva-1.2.3-tarball
# tar -zxvf tpccuva-1.2.3.tar.gz
展開して作成されたファイルに移動し、Makefileを環境に合わせて修正します。Makefileはバックアップを取得しておきます。
# cd /tmp/tpccuva-1.2.3-tarball/tpccuva-1.2.3
# cp -p Makefile Makefile.backup
# vim Makefile
=== 修正内容 ===
 # VARDIR stores where the auxiliary files will be stored during the
 # benchmark execution. Do not forget the last slash!
-VARDIR = $(HOME)/tpcc-uva/var/tpcc/
+#VARDIR = $(HOME)/tpcc-uva/var/tpcc/
+VARDIR = /home/pgsql/tpcc-uva/var/tpcc/

 # EXECDIR stores where the executable files will be stored during the
 # installation. Do not forget the last slash!
-EXECDIR = $(HOME)/tpcc-uva/bin/
+#EXECDIR = $(HOME)/tpcc-uva/bin/
+EXECDIR = /home/pgsql/tpcc-uva/bin/

 # INCLUDEPATH stores the location of PostgreSQL include files.
-export INCLUDEPATH = $(HOME)/tpcc-uva/pgsql/include/
+#export INCLUDEPATH = $(HOME)/tpcc-uva/pgsql/include/
+export INCLUDEPATH = /home/pgsql/tpcc-uva/pgsql/include/

 # LIBSPATH stores the location of PostgreSQL library files.
-export LIBSPATH = $(HOME)/tpcc-uva/pgsql/lib/
+#export LIBSPATH = $(HOME)/tpcc-uva/pgsql/lib/
+export LIBSPATH = /home/pgsql/tpcc-uva/pgsql/lib/
環境変数を設定します。 これは各種プログラムを実行する上で必要ですので、必要であれば実行ユーザの.bashrcなどに記載しておくと良いと思います。
# export PATH=$PATH:/home/tpcc-uva/pgsql/bin:/home/tpcc-uva/bin
# export LD_LIBRARY_PATH=$LD_LIBRARY_PATH:/home/tpcc-uva/pgsql/lib
コンパイルして、インストールを実施します。
# make && make install
以上で、インストール作業が完了しました。
ベンチマークの実行
ベンチマークを実行してみます。
ベンチマーク対象はPostgreSQLサーバは9.2.2で、あらかじめインストールされているものとします。特にパラメータは変更しておらず、インストール時のデフォルトとしています。
実行に必要な環境変数を設定します。※インストール時に設定したものと同様の内容です。
# export PATH=$PATH:/home/tpcc-uva/pgsql/bin:/home/tpcc-uva/bin/
# export LD_LIBRARY_PATH=$LD_LIBRARY_PATH:/home/tpcc-uva/pgsql/lib
TPCC-UVaによるベンチマークプログラム、benchを実行します。
# /home/tpcc-uva/bin/bench


    +---------------------------------------------------+
    | BENCHMARK TPCC  --- UNIVERSIDAD DE VALLADOLID --- |
    +---------------------------------------------------+


        1.- CREATE A NEW TEST DATABASE


        8.- Quit


SELECT OPTION:
※接続できない場合
もし、以下のようなエラーが出る場合、接続ユーザが存在していない可能性があります。 (私の環境ではpostgresユーザを含むOS上のどのユーザで実行しても、rootで接続しようとしてエラーとなっていました。接続ユーザを制御する方法があるのかはわかっていません。)
Error number: -402
        Could not connect to database template1 in line 4208.
Error checking if database exists.
Error number: -220
        No such connection NULL in line 4216.
PostgreSQLにrootユーザを作成します。最低限DB作成権限を与えておきます。
# psql -U postgres
postgres=# CREATE USER root CREATEDB CREATEUSER;
postgres=# select * from pg_user;
 usename  | usesysid | usecreatedb | usesuper | usecatupd | userepl |  passwd  | valuntil | useconfig
----------+----------+-------------+----------+-----------+---------+----------+----------+-----------
 postgres |       10 | t           | t        | t         | t       | ******** |          |
 pgbench  |    16491 | f           | f        | f         | f       | ******** |          |
 root     |    16517 | t           | t        | t         | f       | ******** |          |
(5 rows)
初回実行時は"1.- CREATE A NEW TEST DATABASE"を選んでベンチマーク用のデータベースを作成します。 しばらく待つとベンチマーク用のデータベースとテーブルが作成されます。
SELECT OPTION: 1
warehouses(倉庫)をいくつ作成するか問われます。ここでは1を選択しています。
データが作成されると"Continue..."となるのでEnterキーを押下します。
Enter the number of warehouses: 1
Continue? (y/n): y
Starting to populate database.
Start time: 2013-03-10 11:28:31
POPULATING DATABASE WITH 1 WAREHOUSES...
…
POPULATION COMPLETED.
Start time: 2013-03-10 11:28:31
End time: 2013-03-10 11:39:58

Continue...
続いて以下のような画面となりますが、一旦オプションの"8.- Quit"を選択して実行を終了し、PostgreSQLサーバにログインして、テストデータベースの情報をみてみます。
    +---------------------------------------------------+
    | BENCHMARK TPCC  --- UNIVERSIDAD DE VALLADOLID --- |
    +---------------------------------------------------+


        2.- RESTORE EXISTING DATABASE.
        3.- RUN THE TEST.
        4.- CHECK DATABASE CONSISTENCY.
        5.- DELETE DATABASE.

        7.- CHECK DATABASE STATE.


        8.- Quit


SELECT OPTION:
PostgreSQLサーバにログインすると、tpccというデータベースが作成されており、その中に以下のようなテーブルが作成されていることが分かります。
# psql -U root tpcc
tpcc=# \l
             List of databases
        Name         |  Owner   | Encoding
---------------------+----------+----------
 pgbench             | pgbench  | UTF8
 postgres            | postgres | UTF8
 template0           | postgres | UTF8
 template1           | postgres | UTF8
 tpcc                | root     | UTF8
(9 rows)
tpcc=# \d
          List of relations
 Schema |    Name    | Type  | Owner
--------+------------+-------+-------
 public | customer   | table | root
 public | district   | table | root
 public | history    | table | root
 public | item       | table | root
 public | new_order  | table | root
 public | order_line | table | root
 public | orderr     | table | root
 public | stock      | table | root
 public | warehouse  | table | root
(9 rows)
各テーブルは以下のようなデータが作成されています。 テーブルの中にはデタラメな値が入力されています。
| customer | 顧客テーブル。1倉庫あたり3万行のデータが作成されます。 |
| district | 配送地域テーブル。1倉庫あたり10行のデータが作成されます。 |
| hisotory | 支払い処理履歴テーブル。1倉庫あたり3万行のデータが作成されます。 |
| item | 商品テーブル。倉庫の数に関わらず、10万行のデータが作成されます。 |
| new_orders | 新規注文テーブル。1倉庫あたり9千行のデータが作成されます。ベンチマーク実行中にデータが増加(受注後)/減少(配送後)していきます。 |
| order_line | 注文明細テーブル。1倉庫あたり30万行のデータが作成されます。 |
| orderr | 注文テーブル。1倉庫あたり3万行のデータが作成されます。ベンチマーク実行中にデータが増加していきます。 |
| stock | 在庫テーブル。1倉庫あたり10万行のデータが作成されます。 |
| warehouse | 倉庫テーブル。1倉庫あたり1行のデータが作成されます。 |
続けます。再度benchを実行します。
# bench


    +---------------------------------------------------+
    | BENCHMARK TPCC  --- UNIVERSIDAD DE VALLADOLID --- |
    +---------------------------------------------------+


        2.- RESTORE EXISTING DATABASE.
        3.- RUN THE TEST.
        4.- CHECK DATABASE CONSISTENCY.
        5.- DELETE DATABASE.

        7.- CHECK DATABASE STATE.


        8.- Quit


SELECT OPTION:
オプションの"3.- RUN THE TEST."を選択し、ベンチマークテストを実行してみます。選択肢の
SELECT OPTION: 3
->Enter number of warehouses 1
->Enter number of terminals per warehouse (max. 10) 10
->Enter ramp-up period (minutes) 20
->Enter measurement interval (minutes) 300
Continue? (y/n): y
->Do you want to perform vacuums during the test? (y/n): y
        ->Enter interval between vacuums (minutes): 60
->Do you want to specify the maximum number of vacuums? (y/n): y
        ->Enter the maximum number of vacuums: 1
->Performing vacuums every 60 minutes, to reach a maximum number of 1.
Start the test? (y/n): y
- Number of warehouses: warehousesの数。先ほど作成した数を指定します。
- Number of terminals per warehouse: 1つのwarehousesに対する同時接続数。TPC-C公式仕様書では10となっているようです。
- Ramp-up period: ベンチマークの記録を開始するまでの時間(分単位)。データがメモリにキャッシュされるまでの時間待つのが望ましいため、プログラム実行開始からベンチマーク計測開始までの待ち時間を指定できます。ユーザガイドには20分程度と記載されていますが、環境に合わせて指定します。
- Measurement period: ベンチマーク測定を行う時間(分単位)。2時間(120min)から最大で8時間(480min)の値を指定します。
- interval between vacuums: バキュームを行う間隔(分単位)。
- maximum number of vacuums: バキュームを行う最大回数。
以下のような処理が流れ続けます。終了するまで待ちます。
…
>> NEW_ORDER Transaction.    Terminal 6.        Done.
>> PAYMENT Transaction.      Terminal 8.        Done.
>> PAYMENT Transaction.      Terminal 1.        Done.
>> PAYMENT Transaction.      Terminal 9.        Done.
>> PAYMENT Transaction.      Terminal 0.        Done.
>> NEW_ORDER Transaction.    Terminal 7.        Done.
>> ORDER_STATUS Transaction. Terminal 3.        Done.
>> DELIVERY Transaction.     Terminal 7.        Done.
>> NEW_ORDER Transaction.    Terminal 2.        Done.
>> PAYMENT Transaction.      Terminal 5.        Done.
>> NEW_ORDER Transaction.    Terminal 6.        Done.
>> PAYMENT Transaction.      Terminal 2.        Done.
>> PAYMENT Transaction.      Terminal 8.        Done.
…
結果データの取得
処理が完了したら、結果のデータを収集します。
データの保存先として以下のディレクトリを作成しておきます。
# mkdir -p /tmp/tpccuva_result
benchコマンドを実行し、オプションの"6.- SHOW AND STORE TEST RESULTS"を選択します。 benchを実行した際のカレントディレクトリに*.datというグラフの生成に必要なファイルが作成されますので、出力結果を保存する先のディレクトリに移動しておきます。
# cd /tmp/tpccuva_result
# /home/tpcc-uva/bin/bench


    +---------------------------------------------------+
    | BENCHMARK TPCC  --- UNIVERSIDAD DE VALLADOLID --- |
    +---------------------------------------------------+


        2.- RESTORE EXISTING DATABASE.
        3.- RUN THE TEST.
        4.- CHECK DATABASE CONSISTENCY.
        5.- DELETE DATABASE.
        6.- SHOW AND STORE TEST RESULTS
        7.- CHECK DATABASE STATE.


        8.- Quit


SELECT OPTION: 6
以下のようなデータが結果が表示されますが、最後にファイルに出力できるのでそのままEnterキーを押下し続けます。
Computation of performance test done on 2013-03-10 at 13:25:27 for 1 warehouses.

Start of measurement interval: 20.000083 m

End of measurement interval: 320.000083 m

COMPUTED THROUGHPUT: 12.537 tpmC-uva using 1 warehouses.
 8642 Transactions committed.
NEW-ORDER TRANSACTIONS:
  3761 Transactions committed into measurement interval. Total transactions: 4015.
  Percentage of Total transactions: 43.520%
  Percentage of "well done": 100.000%
  Response time (min/avg/max/90th): 0.012 / 0.047 / 0.277 / 0.040
  Percentage of rolled-back transactions: 1.064% .
  Average number of items per order: 9.360 .
  Percentage of remote items: --- (One warehouse only).
  Think time (min/avg/max): 0.000 / 12.167 / 109.000

Continue...

PAYMENT TRANSACTIONS:
  3757 Transactions committed into measurement interval. Total transactions: 4019.
  Percentage of Total transactions: 43.474%
  Percentage of "well done": 100.000%
  Response time (min/avg/max/90th): 0.002 / 0.018 / 0.299 / 0.000
  Percentage of remote transactions: --- (One warehouse only)
  Percentage of customers selected by C_ID: 40.964% .
  Think time (min/avg/max): 0.000 / 12.141 / 109.000

Continue...

ORDER-STATUS TRANSACTIONS:
  372 Transactions committed into measurement interval. Total transactions: 400.
  Percentage of Total transactions: 4.305%
  Percentage of "well done": 100.000%
  Response time (min/avg/max/90th): 0.003 / 0.018 / 0.218 / 0.000
  Percentage of customers selected by C_ID: 42.742% .
  Think time (min/avg/max): 0.000 / 9.642 / 50.000

Continue...

DELIVERY TRANSACTIONS:
  376 Transactions committed into measurement interval. Total transactions: 402.
  Percentage of Total transactions: 4.351%
  Percentage of "well done": 100.000%
  Response time (min/avg/max/90th): 0.000 / 0.000 / 0.001 / 0.000
  Percentage of execution time < 80s : 100.000%
  Execution time min/avg/max: 0.031/0.061/0.171
  No. of skipped districts: 0 .
  Percentage of skipped districts: 0.000%.
  Think time (min/avg/max): 0.000 / 5.136 / 25.000

Continue...

STOCK-LEVEL TRANSACTIONS:
  376 Transactions committed into measurement interval. Total transactions: 402.
  Percentage of Total transactions: 4.351%
  Percentage of "well done": 100.000%
  Response time (min/avg/max/90th): 0.003 / 0.020 / 0.150 / 0.000
  Think time (min/avg/max): 0.000 / 4.987 / 25.000

Continue...


Longest checkpoints:
Start Time      Elapsed time since test start (s)       Execution time (s)
Sun Mar 10 13:45:27 2013        1200.029000             11.729000
Sun Mar 10 16:45:44 2013        12016.485000            4.010000
Sun Mar 10 14:45:39 2013        4812.168000             3.007000
Sun Mar 10 18:15:48 2013        17421.301000            0.601000
Continue ...


Longest vacuums:
Start Time      Elapsed time since test start (s)       Execution time (s)
Sun Mar 10 14:25:27 2013        3600.040000             7.242000

>> TEST PASSED
Continue...
ここでファイルに出力するかどうか問われます。
"y"を入力し、ファイル名を適当に付けて保存します。ここでは/tmp/tpccuva_result配下にtpcc-uva_result_20130310.tpcとして出力させることとし、/tmp/tpccuva_result/tpcc-uva_result_20130310.tpcという形で指定しています。なお、ディレクトリを指定しない場合、ファイルはbenchを実行した際のカレントディレクトリに出力されます。
ここで保存し忘れても再度"6.- SHOW AND STORE TEST RESULTS"を指定して出力できます。
Do yo want to store the results into a file? (y/n): y
   Enter file name (prefereably with .tpc extension)
   filename: /tmp/tpccuva_result/tpcc-uva_result_20130310.tpc
   Results have been written on file /tmp/tpccuva_result/tpcc-uva_result_20130310.tpc.
Continue...
Gnuplotでのグラフ出力
Gnuplotで結果をグラフ出力します。付属のPDRファイル:tpccuva-guide.pdfのP17~P18ページの内容を元に以下のようなスクリプトを作成します。
# vim /tmp/tpccuva_result/tpccuva_result/516.gnp
set terminal postscript 22
set size 1 , 1
set pointsize 1
set output "/tmp/tpccuva_result/561-NewOrder.eps"
set title "Response Time Distribution, New Order transactions"
set xlabel "Response Time (s)"
set ylabel "Number of Transactions"
plot [0: XX ] "/tmp/tpccuva_result/g1NewOrder.dat" with lines

set output "/tmp/tpccuva_result/561-Delivery.eps"
set title "Response Time Distribution, Delivery transactions"
set xlabel "Response Time (s)"
set ylabel "Number of Transactions"
plot [0: XX ] "/tmp/tpccuva_result/g1Delivery.dat" with lines

set output "/tmp/tpccuva_result/561-OrderStatus.eps"
set title "Response Time Distribution, Order Status transactions"
set xlabel "Response Time (s)"
set ylabel "Number of Transactions"
plot [0: XX ] "/tmp/tpccuva_result/g1OrderStatus.dat" with lines

set output "/tmp/tpccuva_result/561-Payment.eps"
set title "Response Time Distribution, Payment transactions"
set xlabel "Response Time (s)"
set ylabel "Number of Transactions"
plot [0: XX ] "/tmp/tpccuva_result/g1Payment.dat" with lines

set output "/tmp/tpccuva_result/561-StockLevel.eps"
set title "Response Time Distribution, Stock Level transactions"
set xlabel "Response Time (s)"
set ylabel "Number of Transactions"
plot [0: XX ] "/tmp/tpccuva_result/g1StockLevel.dat" with lines
"set output"で出力するファイル名を指定します。
グラフのサイズは"set size X, X"で調整します。
"plot[0: XX]"の"XX"は各ベンチマーク結果の"Response time (min/avg/max/90th)"の"90th"の4倍の値を指定します。
作成したスクリプトを実行します。
# /home/tpcc-uva/bin/bin/gnuplot /tmp/tpccuva_result/516.gnp
作成されたファイルの1つを画像ビューアで観てみますと以下のような形となります。
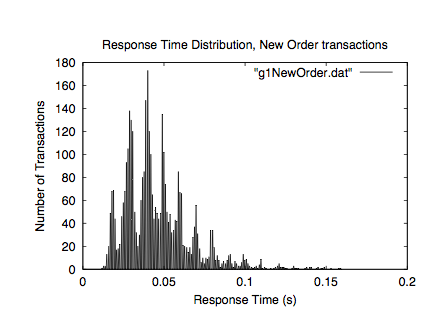
以上のように結果やグラフを収集し、分析/チューニングをしていくことになります。
まだ結果をきちんと確認できていませんが、上記の内容で実行した際にはCPUの%user使用率が100%に張り付いた状態となり、ほとんどI/O負荷は発生しませんでした。 "COMPUTED THROUGHPUT: 12.537"となっており、CPUがネックなのかCPUに負荷がかかる仕様なのか分かりませんが、まずは、ベンチマークの内容を見直してみる必要があるように思っています。
おわりに
PostgreSQLのベンチマーク、パフォーマンスチューニング等のために使えるかと思ってTPCC-UVaを試してみました。開発が進んでいないように思え残念ですが、ベンチマーク用のDBの作成やベンチマーク結果出力、ベンチマーク用のテーブルの削除などがインタラクティブに実行できる点は割と使いやすいように思いました。
ただ、最近ではPostgreSQLに対応したベンチマークツールは最近では他にももっと良いツールがあるかも知れません。